When done well, email marketing is a terrific digital marketing strategy that can drive a ton of traffic and generate new leads to your website.
In fact, according to several studies, email marketing produces $44 for every $1 spent. If that isn’t a pretty amazing ROI, I don’t know what is!
With email marketing, you can reach your target audience regularly, provide them with personalized offers, and can give them a much needed new reason to visit your website.
There is also a plethora of great automated tools now available to help you not only create your campaigns, but also schedule them, send them, design them, and even troubleshoot them. So now not only is email marketing a great marketing strategy, but the return on investment is even better than before with time-saving tools like these.
So, needless to say, the value of email marketing in your digital marketing campaigns has been proved. But, in order to make sure it brings as much value to your business as it can, you need to be sure your campaigns are optimized.
To do so, you need to monitor the right stats with an email marketing report – something that would look a little like this:
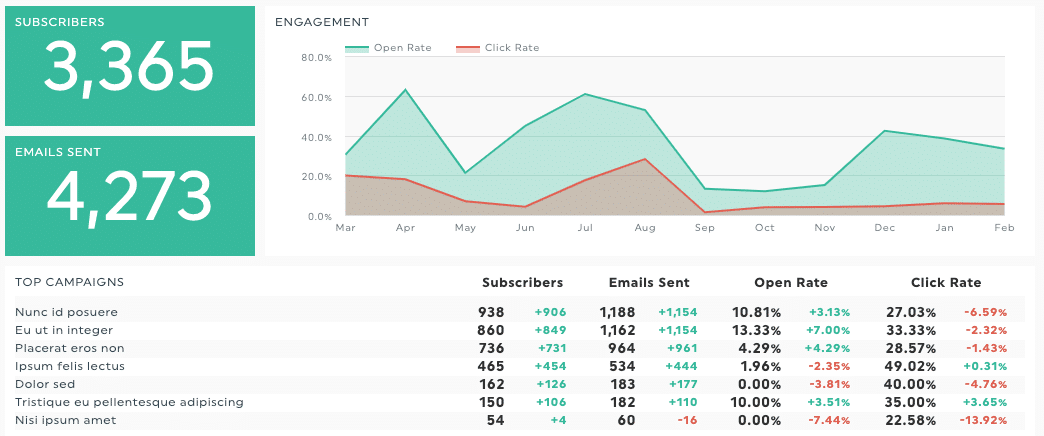

Having a marketing report that’s tracking the right email marketing KPIs is of the utmost importance, since it allows you to make sure that not only are your emails being opened, but also that you get the traffic, conversions, and sales that you were aiming for.
Without proper tools for campaign planning and tracking, your email campaigns can become nothing less than a monumental waste of time; even worse, they can have a negative effect by increasing your unsubscribe rate, as we will see a little further in this article.
Tracking your different KPIs gives you a much better chance of determining what’s bringing your strategies down, and what’s working best. Therefore giving you time to adjust your campaigns, tweak different things like your subject lines, your call to action, your email design, your segmentation, and more.
So create your marketing report right now, and include these 7 essential email marketing key performance indicators to get the most out of your email campaigns.
1. Number of subscribers

This email marketing metric tells you the number of people who have opted in to receiving promotional or marketing emails from you.
Fundamentally, it’s a measure of how many potential eyeballs will see your email marketing efforts, so monitoring your list growth rate (the number of new subscribers and your unsubscribe rate) can be a gauge of the level of interest in your products or services.
You want to keep your number of subscribers as high as possible and ensure a low churn rate. Also keep this number in mind when you do campaigns to gain new subscribers for your newsletter, contests, or other marketing efforts to grow your subscriber list.
2. Open rate
The open rate tells you how many people on your email list opened a campaign email you sent out.
There are a few things that affect email open rates, such as the bounce rate, subject line of the email, the relevance of the email to your target audience, or whether the emails are landing up in the spam folder instead of the inbox.
So, needless to say, this is one of the most important metrics to track in order to optimize your campaigns. If you see your open rate declining, you’ll want to investigate a bit further and fix any issues.
3. Click-through rate (CTR)
This important metric measures the total number of subscribers who clicked a link in one of your emails.
There are two types of click-through rates you can measure:
- Total click-through rate
- Unique click-through rate
It’s generally best to focus on the unique click-through rate, which measures the number of people who clicked on links, rather than the total number of clicks an email has received. After all, what you really want to know is how many people were attracted by your email or offer, not how many times they clicked on it.
4. Number of email bounces
Bounces have to do with email deliverability – an email “bounces” when it’s not able to be delivered to a recipient for some reason or another. There are two kinds of bounces: hard bounces and soft bounces.
Hard bounces occur when there’s no possible way for the email message to be delivered, such as when the email address no longer exists.
Soft bounces, on the other hand, mean there’s just a temporary reason for non-delivery, such as when the recipient’s inbox is full.
You’ll want to ensure good email list hygiene and delete email addresses that result in a hard bounce.
5. Website traffic

Email marketing is just one piece of the puzzle – you need to monitor how all your marketing channels, from SEO to social media, affect one another by tracking important metrics in Google Analytics and social media analytics tools.
Ultimately, the goal of an email marketing strategy, apart from lead generation, is to bring in website traffic and conversions. Tracking how your email marketing campaigns are affecting web traffic with dashboards tracking Google Analytics data is a simple and effective solution for ensuring you’re getting optimal results.
Make sure you’re tracking not only your overall traffic, but your traffic by medium, as well as a month-over-month or year-over-year comparison, to really see the trends.
6. Number of unsubscribes
The unsubscribe rate shows you how many people have unsubscribed from one of your email marketing campaigns.
Of course, your number one goal is to retain your subscribers as much as possible. To do so, you should investigate some of the possible reasons for an increase in the number of unsubscribes, such as sending emails too frequently or presenting irrelevant content.
7. Number of conversions

This email metric tells you how many people clicked on a link in your email and then took a desired action, such as making a purchase on your e-commerce website.
The number of conversions, as well as your conversion rate, are key metrics you should always have your eye on since they can have a direct impact on your return on investment and your business goals.
There are many ways you can improve your conversions, such as improving your newsletter design, your CTAs, or your promotions. You can also try to segment your audience better, so that you only send relevant promotions or information to each person depending on their profile.
Track all these KPIs in a marketing report
The tools
In order to track all these KPIs, you can use an Excel spreadsheet (or Google Sheet) and simply copy-paste all this data every month from your different platforms, such as Mailchimp, Campaign Monitor, Hubspot, or Google Analytics. Alternatively, you could use a go-to-market platform like Dealfront to track and collect data from multiple campaigns. You could also use an automated reporting tool to keep track of this data without having to fetch it yourself every month.
Automated reporting
There are multiple automated SaaS reporting tools available, such as DashThis, Zoho, Tableau or Geckoboard; all very useful alternatives to DashThis depending on your needs.
DashThis

DashThis is an automated marketing tool for agencies and marketers. The tool is particularly useful if you want to present a good-looking report to your clients or boss. It has multiple time-saving features like preset templates, cloning options, preset widgets, and more. It is known for its ease of use and second-to-none customer service.
Zoho

Zoho is a business analytics tool used to carry out in-depth analytics for different spheres of your business (sales, marketing, social media analytics, finance, HR, etc.). You can then present your data with different types of reports.
Tableau

Tableau is a data visualisation tool that helps businesses track and analyse their data for their different industries and departments. It is very customizable and offers a lot of different options.
Geckoboard

Geckoboard is a dashboard tool that helps you present your data for your team, on either a TV or monitor. It helps your team easily follow up on their performance in real-time.
The templates
You can also use report templates to help you track these KPIs faster. These templates are pre-filled with the most common email marketing KPIs so you don’t have to add them all manually.
Best practices to follow
The layout
Another important reporting tip is to make sure you present your data with some graphs and charts. This will really enable you to better understand the trends in your data. Are you going in the right direction? Is there a causality between my decrease of hard bounces and increase of open rate? It’s all a lot easier to see with clear graphs, which can be generated from an AI-powered dashboard in one of the above-mentioned tools.
The comparisons
You should also make sure you compare your data year-by-year as well as month-by-month, so that you take into consideration the seasonality of your data. This will help you see if, for example, your lower open rate is due to the campaign itself, the holidays, or if this seems normal for this period of the year.
The frequency
You should create a monthly report for your email marketing strategies. Why monthly? Because less than a month might not represent enough data to be able to see trends and make decisions based on the data. A weekly or daily report can always be used for very short term promotions that you would like to track closely.
However, more than a month is a pretty long time. If you use quarterly reports, for example, you might see that your campaign has had bad results for over 2 months, without you ever knowing. By tracking your data monthly you can stop a bad campaign in its tracks, modify it, and make sure your strategies are always optimal.
The same goes for a yearly report – it should only be used as a recap of all your different strategies and campaigns of the year. You can use yearly and quarterly reports to get a good overview of what worked out or not, and adjust for the next year.
You’re all set!
These are the most important marketing KPIs you need to track for your email reports so that you can adjust your email marketing campaigns accordingly. Make sure to track all this data every month, and you’ll be all set to have successful campaigns.
If you need more email marketing tips, Mailtrap has a plethora of blog posts you should check out!